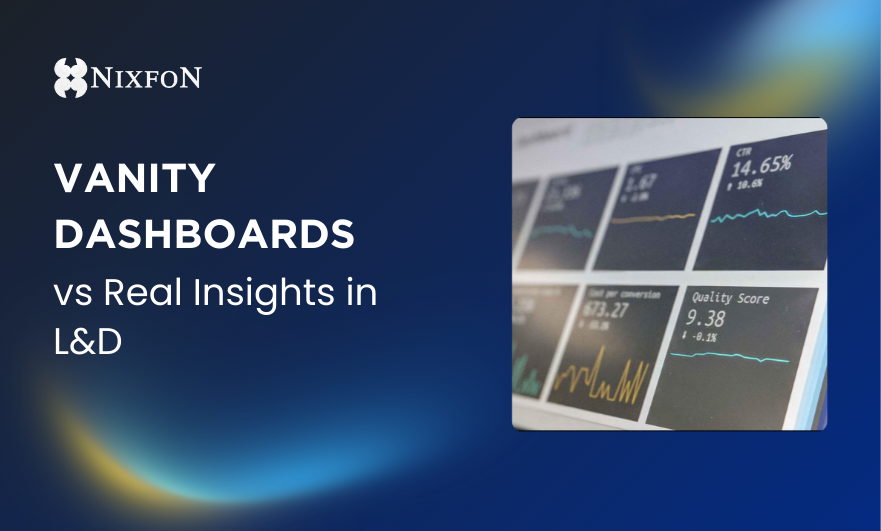
Vanity Dashboards vs Real Insights in L&D
When Pretty Charts Are Not Enough Let’s be honest. There is a certain satisfaction in presenting a dashboard full of colourful graphs. Completion rates are rising. Learning hours are accumulating. Attendance percentages are glowing in confident shades of green.
Hazie Halim
3/19/20264 min read
When Pretty Charts Are Not Enough
Let’s be honest. There is a certain satisfaction in presenting a dashboard full of colourful graphs. Completion rates are rising. Learning hours are accumulating. Attendance percentages are glowing in confident shades of green.
It feels productive. It feels impressive.
But here is the uncomfortable question – is it telling the business anything useful?
Welcome to the quiet tension in modern L&D. The difference between vanity dashboards and real insights.
What is A Vanity Dashboard?
A vanity dashboard is the learning equivalent of counting applause without knowing whether the audience understood the message. It typically focuses on the number of participants, learning hours consumed, course completion rates, and satisfaction scores. These metrics aren’t wrong. They are just incomplete.
Vanity dashboards answer the question: “Did people attend?” They rarely answer: “Did it change anything?”
The problem is not the data itself. The problem is mistaking activity for impact.
When leadership asks about ROI, showing 12,000 learning hours can feel like presenting a beautifully wrapped gift box that is empty inside.
What Are Real Insights?
Real insights go deeper. They connect learning activity to performance, capability, and business outcomes. They explore questions like:
Did sales improve after product training?
Did leadership programs reduce attrition?
Did compliance training lower incident rates?
Are skill gaps shrinking in priority areas?
Real insights move from descriptive data to interpretive data. Not just “we delivered 25 workshops,” but “teams that attended the workshop reduced error rates by 18% within 3 months.”
That is a different conversation. And a far more strategic one.
Why Meaningful Data Matters
L&D today operates in an environment where budgets are scrutinized and priorities compete. When dashboards focus only on engagement metrics, L&D risks being perceived as a cost center that runs events. When dashboards focus on performance indicators, L&D becomes a capability driver.
Meaningful data does three powerful things:
It builds credibility
Business leaders think in outcomes. Revenue, productivity, efficiency, and risk reduction. When L&D speaks that language through data, trust grows.
It supports better decisions
If a program has high completion rates but zero impact on performance, should it continue? Without insight, L&D may continue investing in initiatives that look successful but do not move the needle. Real insights allow prioritisation based on value, not volume.
It protects budget and influence
In challenging economic times, initiatives that cannot demonstrate impact are the first to be cut. Strategic reporting safeguards L&D’s position at the decision-making table. It transforms reporting from defensive to confident.
The Role of Strong Data Analytics
Collecting data is easy. Telling a strategic story with it is the real craft.
Strong data analytics in L&D involves:
Connecting multiple data sources
Learning data alone rarely tells the full story. It needs to integrate with performance data, HR metrics, business KPIs, and operational outcomes. When data points begin to talk to each other, patterns emerge. And patterns create insight.
Asking better questions
Analytics is not about more dashboards. It is about better questions. Instead of “how many completed the course?”, ask “what behaviour should change because of this course, and how will we measure it?”. The clarity of the question determines the usefulness of the data.
Interpreting, not just reporting
Numbers do not speak on their own. Someone must interpret them. A completion rate of 95% may look excellent, but if assessment scores are low or performance remains unchanged, that 95% tells a different story.
Strong analytics turns raw numbers into a narrative. It answers what happened, why it happened, and what we should do next. That final question is where strategy begins.
Moving From Vanity to Value
Transitioning away from vanity dashboards does not mean abandoning traditional metrics entirely. It means repositioning them. Attendance and completion are leading indicators. They show participation. But, they must be paired with lagging indicators that show outcomes.
For example:
Instead of reporting “500 employees completed digital skills training,”, start the report with “500 employees completed digital skills training, and within 6 months, automation adoption increased by 30% and manual processing time decreased by 15%.”
Now the data tells a story. And stories influence decisions.
Sometimes, vanity dashboards exist because deeper analytics feels intimidating. Data integration is complex. Measurement frameworks require clarity. Stakeholders may not always align on success criteria.
But avoiding complexity does not reduce it. It only postpones it.
The good news is that L&D does not need to become a data science department overnight. Start small by defining success before launching programs, aligning learning objectives with business KPIs, and collaborating with HR and operations for shared metrics.
Incremental progress builds analytical maturity.
Vanity dashboards celebrate activity. Strategic analytics celebrate impact.
In today’s environment, L&D does not just need beautiful dashboards. It needs meaningful narratives backed by credible data. Because when data tells a strategic story, L&D stops reporting numbers. It starts shaping decisions.
Till we meet again in the next episode!


About the author
Hazie Halim has more than 15 years of experience in Talent Management Solution and L&D Tech. Her approach has never been about the technology; it has always been about the people in the industry. She understands HR & L&D, she understands the pain and the stress, and she understands the fear and reluctance of system integration drama. Combining these has allowed her to be compassionate when sharing her experience and knowledge during project implementation. She is passionate about making the HR & L&D experts look good in front of their stakeholders. Their win is her win.


Unlock a world of thrilling content
Join our newsletter today
Resources
Unit 7.06, Level 7, Amcorp Trade Centre, 18, Persiaran Barat, 46050 Petaling Jaya, Selangor.
Nixfon (M) Sdn Bhd (633379-V)